(Stacker) – Last year, more than 49 million Americans hit the road for Thanksgiving. Unfortunately, according to the National Safety Council, it’s one of the most dangerous driving holidays in the United States.
Using data from the National Highway Traffic Safety Administration, researchers at TruckInfo.net discovered a few worrying trends for Thanksgiving travelers.
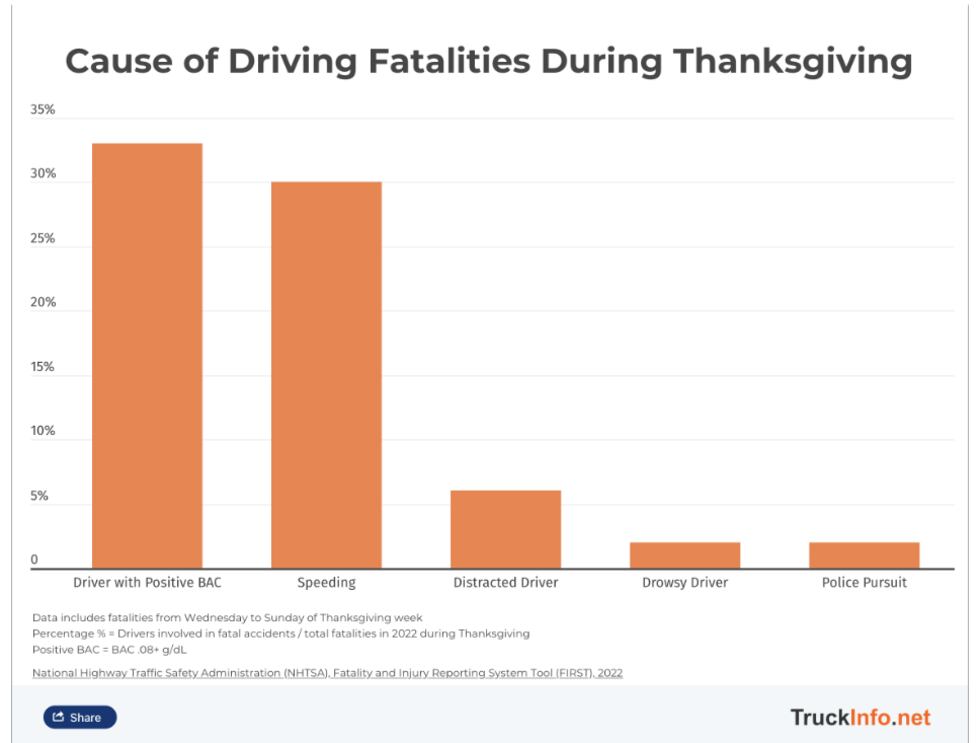
Despite Uber and Lyft helping to reduce alcohol-related traffic fatalities by 6.1%, drunk driving remains an issue on Thanksgiving—likely because most rideshare drivers are spending time with their families over the holidays.

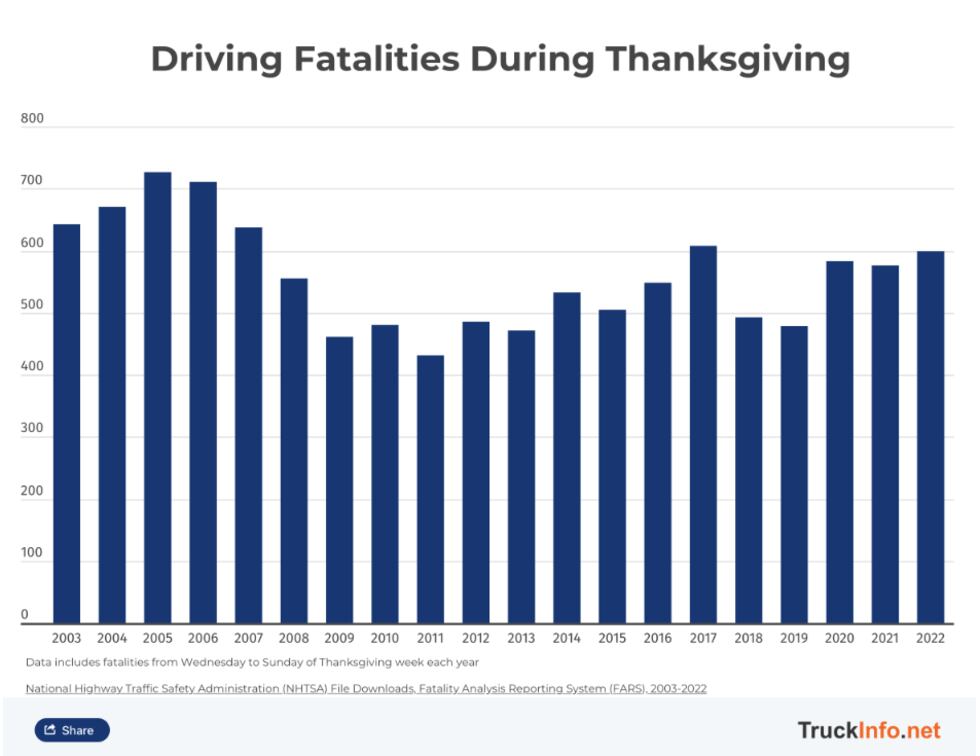
While 2005 to 2011 saw a meaningful decline in fatalities, progress has stalled and moved in the other direction—with fatalities up nearly 38% from the 20-year low.

While it’s not surprising that metro areas with large populations would also have the most driving fatalities during the holidays, four of the top 10 most dangerous roads in the country are in counties with fewer than half a million residents.
From 2003 to 2022, the following roadways had the most fatalities during the Thanksgiving holidays:
- I-15 in San Bernardino County, CA : 11 (population: 2.19M )
- SR-85 in Okaloosa County, FL : 10 (population: 216k)
- I-15 in Riverside County, CA: 10 (population: 2.47M)
- I-10 in Maricopa County, AZ: 10 (population: 4.56M)
- I-5 in Los Angeles County, CA: 10 (population: 9.72M)
- I-605 in Los Angeles County, CA: 10 (population: 9.72M)
- I-10 in Ascension Parish County, LA: 9 (population: 130k)
- SR-91 in Indian River County, FL: 9 (population: 167k)
- I-8 in Imperial County County, CA : 9 (population: 179k)
- US-1 in Brevard County, FL: 9 (population: 631k)

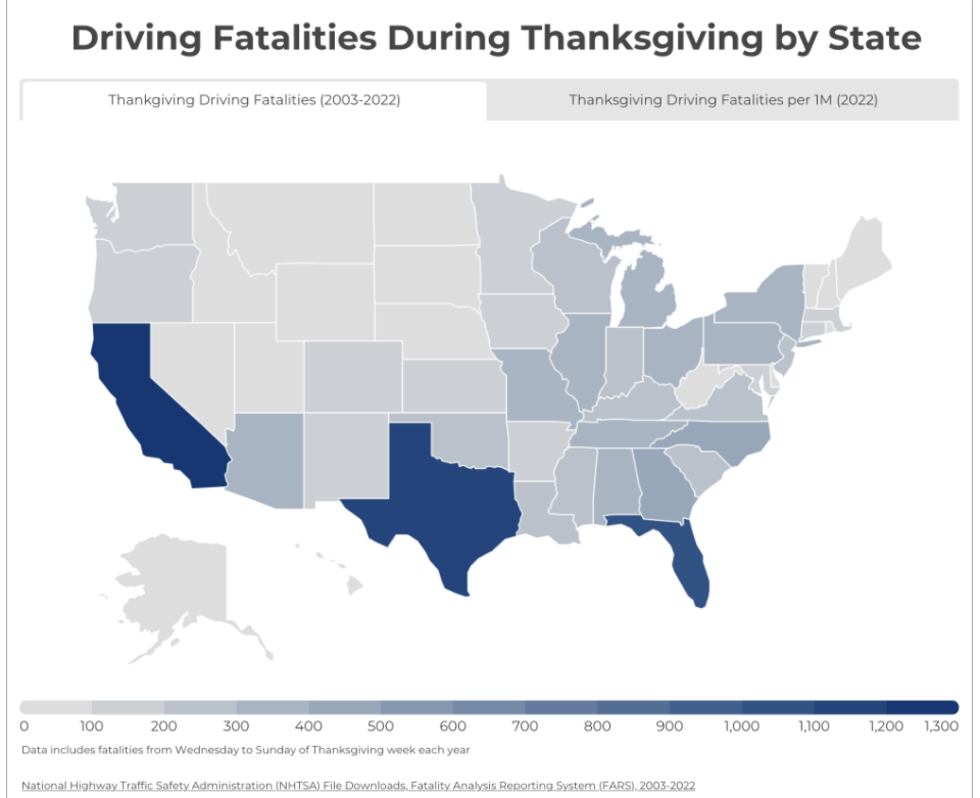
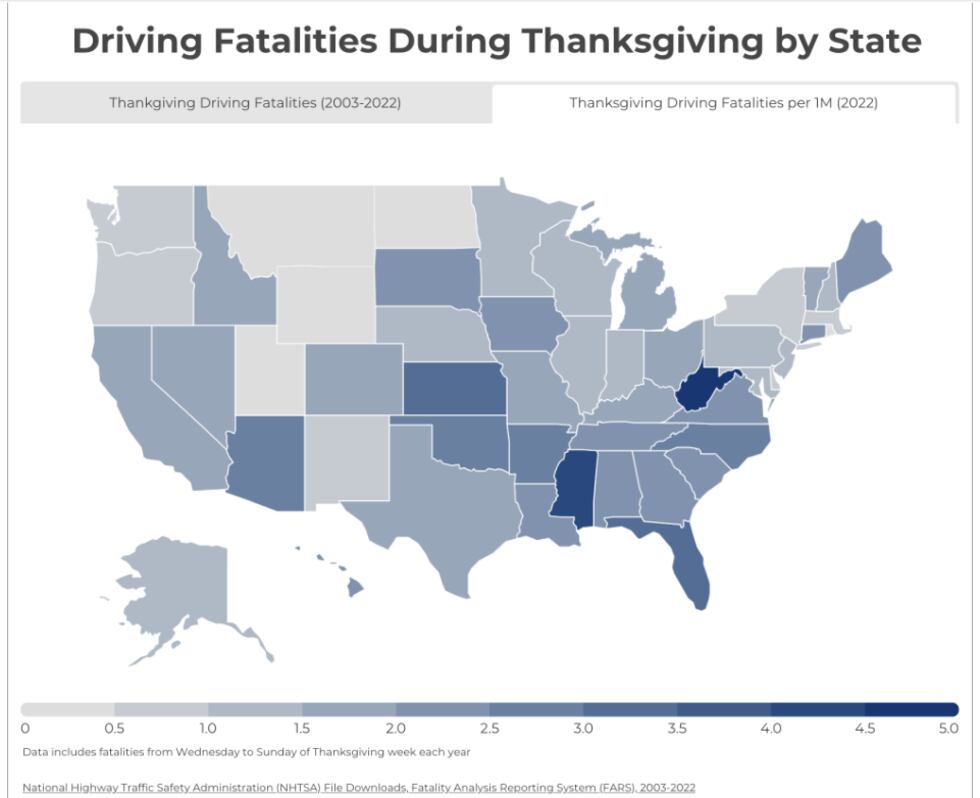
While large states like California, Texas, and Florida have the most total driving fatalities during Thanksgiving, West Virginia and Mississippi have the most fatalities per capita by a wide margin—both nearly 50% higher than the next state.

Fatal accident statistics were sourced from the National Highway Traffic Safety Administration (NHTSA) and population data was sourced from the US Census Bureau. The Thanksgiving holiday period was defined as the Wednesday before Thanksgiving through the Sunday afterward. Unless otherwise noted, all fatality statistics are the sum of total fatalities from 2003 to 2022 (the most recent data available) and population data is from 2022.
This story was produced by TruckInfo.net and reviewed and distributed by Stacker.
Copyright 2024 Stacker via Gray Local Media, Inc. All rights reserved.